Spring/Ticketing 프로젝트
공연 정보 조회 API 쿼리 분석하고 개선하기
minturtle
2024. 11. 15. 16:03
반응형
개요
- 티케팅 어플리케이션의 개발 및 배포가 완료되어서, 이제 성능 측정을 해보려 합니다.
- 이번에 성능 개선을 할 API는 공연 정보 API 입니다.
- 지금 아래와 같이 Performance가 검색 조차 되지 않는데, 쿼리 분석을 하고 정상적으로 검색이 되도록 수정해보고자 합니다.
[LdrxyZMp]|||-> PerformanceReader.searchPerformanceSummaryDto [LdrxyZMp]|||<X- PerformanceReader.searchPerformanceSummaryDto ended by exception DataAccessResourceFailureException [Sldi1Gc3]|||-> PerformanceReader.searchPerformanceSummaryDto [Sldi1Gc3]|||<X- PerformanceReader.searchPerformanceSummaryDto ended by exception DataAccessResourceFailureException [NztCOAr_]|||-> PerformanceReader.searchPerformanceSummaryDto [NztCOAr_]|||<X- PerformanceReader.searchPerformanceSummaryDto ended by exception DataAccessResourceFailureException [wnvuZP2a]|||-> PerformanceReader.searchPerformanceSummaryDto [wnvuZP2a]|||<- PerformanceReader.searchPerformanceSummaryDto ended at 2390513ms [6UfiDxGX]|||-> PerformanceReader.searchPerformanceSummaryDto [6UfiDxGX]|||<- PerformanceReader.searchPerformanceSummaryDto ended at 2511440ms
Performance : 약 150만개
PerformanceDatetimes : 약 330만개
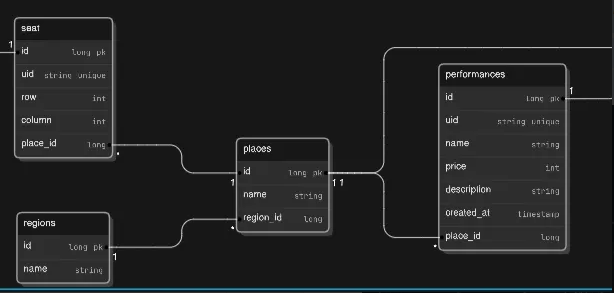
테이블의 ERD는 다음과 같습니다.
현재 보고 계신 글은 공연 조회 API 최적화 시리즈 입니다!
1편 :공연 정보 조회 API 쿼리 분석하고 개선하기
2편 :공연 조회 API 성능 측정 및 개선 사안 찾아보기
3편 :공연 조회 API에 캐싱을 적용하고 성능 테스트하기
4편 :아키텍처 최적화, 로그 방식 변경을 통한 공연 정보 조회 API 최적화 하기
쿼리 보기
- 쿼리는 아래와 같습니다.
select
        p1_0.uid,
        p1_0.image,
        p1_0.name,
        r1_0.name,
        min(pdt1_0.show_time),
        max(pdt1_0.show_time)
    from
        performances p1_0
    join
        performance_datetimes pdt1_0
            on pdt1_0.performance_id=p1_0.id
    join
        performance_places pp1_0
            on p1_0.place_id=pp1_0.id
    join
        regions r1_0
            on pp1_0.region_id=r1_0.id
    where
        1=1
    group by
        pdt1_0.performance_id
    order by
        p1_0.id desc
    offset
        ? rows
    fetch
        first ? rows only
select
count(p1_0.id)
from
performances p1_0
join
performance_datetimes pdt1_0
on pdt1_0.performance_id=p1_0.id
join
performance_places pp1_0
on p1_0.place_id=pp1_0.id
join
regions r1_0
on pp1_0.region_id=r1_0.id
where
1=1
group by
pdt1_0.performance_id- 일단 첫번째로 거슬리는건 불필요한 Count 조회 쿼리가 나간다는 것입니다.
- 찾아보니 kotlinJdslJpqlExecutor.findPage() 메서드가 내부적으로 카운트 쿼리를 사용한다고 합니다.
- 하지만 현재 API는 커서 페이지네이션이기 때문에 카운트 쿼리가 필요없습니다. 따라서 카운트 쿼리를 제거해보도록 하겠습니다.
Before
 kotlinJdslJpqlExecutor.findPage(PageRequest.of(0, cursorInfoDto.limit)) {
 // ...
 }
After
kotlinJdslJpqlExecutor.findAll(PageRequest.of(0, cursorInfoDto.limit)) {

}- 이렇게 변경하고 쿼리를 조회하면 아래와 같이 쿼리가 한번 나가도록 바뀌었음을 확인할 수 있었습니다.
select
    p1_0.uid,
    p1_0.image,
    p1_0.name,
    r1_0.name,
    min(pdt1_0.show_time),
    max(pdt1_0.show_time)
from
    performances p1_0
join
    performance_datetimes pdt1_0
        on pdt1_0.performance_id=p1_0.id
join
    performance_places pp1_0
        on p1_0.place_id=pp1_0.id
join
    regions r1_0
        on pp1_0.region_id=r1_0.id
where
    1=1
group by
    pdt1_0.performance_id
order by
    p1_0.id desc
offset
    ? rows
fetch
first ? rows only- 이제 이 쿼리를 explain절을 한번 실행해 보았습니다.
explain select p.uid, p.image, p.name as 'title' , date(min(pd.show_time)) as start_date, date(max(pd.show_time)) as end_date, r.name as 'regionName' from performances p
	join performance_datetimes pd on p.id = pd.performance_id
    join performance_places pp on p.place_id = pp.id
    join regions r on r.id = pp.region_id
    where 1=1
    group by pd.performance_id
	order by p.id desc limit 0, 10;
| table | type | possible_keys | key | ref | filtered | Extra |
| p | ALL | PRIMARY,FK888vq870okmpvmvj6wg3kqt3k | 100.00 | Using temporary; Using filesort | ||
| pp | eq_ref | PRIMARY,FKi51y339o8qfbb795gyko9cur2 | PRIMARY | ticketing.p.place_id | 100.00 | |
| r | eq_ref | PRIMARY | PRIMARY | ticketing.pp.region_id | 100.00 | |
| pd | ref | FK5mqulsthehqtjvn37qabaggeg | FK5mqulsthehqtjvn37qabaggeg | ticketing.p.id | 100.00 |
- explain절을 실행해 보았을 때 pp(performancePlace), r(Region), pd(PerformanceDateTime)은 문제가 안되지만, p(PerformancePlace)는 문제점이 존재합니다.
- Using filesort : Index Sort가 적용되어 있지 않기 때문에 효율적인 커서 페이지네이션이 적용되지 않습니다.
- Using temporary: 복잡한 Join문 때문인지, Group By 때문인지, 혹은 둘다 원인인지 알 수 없지만 임시 테이블을 사용합니다.
- 위 쿼리에서 커서 페이지 네이션을 올바르게 사용하기 위해선 indexsort가 필수적이기 때문에, indexsort의 적용을 목표로 했습니다.
쿼리 개선하기
- 일단 지금 Group By 절 때문에 Where 절에 아무 조건이 없고, Id로 정렬을 함에도 불구하고 인덱스를 타지 않기 때문에 인덱스를 타도록 SELECT 문을 두개로 분리해보기로 했습니다.
select
		p1_0.id,
        p1_0.created_at,
        p1_0.description,
        p1_0.image,
        p1_0.name,
        pp1_0.id,
        pp1_0.created_at,
        pp1_0.name,
        r1_0.id,
        r1_0.created_at,
        r1_0.name,
        r1_0.uid,
        r1_0.updated_at,
        pp1_0.updated_at,
        p1_0.price,
        p1_0.uid,
        p1_0.updated_at
from performances p
    join performance_places pp on p.place_id = pp.id
    join regions r on r.id = pp.region_id
    where 1=1
	order by p.id desc limit 0, 10;
select pd.performance_id, date(min(pd.show_time)) as start_date, date(max(pd.show_time)) as end_date
from performance_datetimes pd
where pd.performance_id in (100123, 100122, 100121, 100120, 100119, 100118, 100117, 100116)
group by pd.performance_id;- 쿼리를 간단하게 설명해 보자면, Group By를 해서 startDate와 endDate를 하는 쿼리와 Performance의 정보를 조회하는 쿼리를 분리하였습니다. 첫번째 쿼리인 Performance의 정보를 조회할 때 p.id를 받아 2번째 쿼리의 where절 IN 절에 id 리스트를 넣어줍니다.
- 먼저 첫번째 쿼리의 explain절은 다음과 같습니다.
| table | type | possible_keys | key | ref | filtered | Extra |
| pp | index | PRIMARY,FKi51y339o8qfbb795gyko9cur2 | FKi51y339o8qfbb795gyko9cur2 | 100.00 | Using index; Using temporary; Using filesort | |
| r | eq_ref | PRIMARY | PRIMARY | ticketing.pp.region_id | 100.00 | |
| p | ref | FK888vq870okmpvmvj6wg3kqt3k | FK888vq870okmpvmvj6wg3kqt3k | ticketing.pp.id | 100.00 |
- 이는 첫번째 쿼리의 explain 절인데, 옵티마이저가 performance가 아닌 performance_place를 드라이빙 테이블로 설정하기 때문에 이전보단 나을지 몰라도 아직 cursor paigination이 효율적으로 사용되는 것 같아 보이지는 않습니다.(물론 performance에 비해 performancePlace가 압도적으로 적기 때문에 PerformancePlace를 드라이빙 테이블로 설정하는게 더 빠를수도 있을 것 같습니다. )
| table | type | possible_keys | key | ref | filtered | Extra |
| pd | range | FK5mqulsthehqtjvn37qabaggeg | FK5mqulsthehqtjvn37qabaggeg | 100.00 | Using index condition |
- 두번째 쿼리는 performance_datetime에서의 performance.id가 FK로 걸려있기 때문에 FK 인덱스만을 사용해서 효율적인 조회를 하는 것으로 보입니다.
- 이제 두 쿼리를 실행하고, 두 쿼리의 결과를 어플리케이션에서 병합하여 제공하도록 해보도록 하겠습니다.
- 어플리케이션 코드는 다음과 같습니다.
class PerformanceService(...){

    fun search(
        cursorInfoDto: CursorInfoDto
    ): List<PerformanceSummarySearchResult> {
        val performanceMap =
            performanceReader.findPerformanceEntityWithPlaceAndRegion(cursorInfoDto)
                .associateBy { it.id }
                .toMap(LinkedHashMap())

        val startEndDateResultMap = performanceReader.findPerformanceStartAndEndDate(performanceMap.keys.toList())
            .associateBy { it.performanceId }

        return performanceMap.entries.map {
            val startEndDateResult = startEndDateResultMap[it.key]
            val performance = it.value
            PerformanceSummarySearchResult(
                performance.uid,
                performance.image,
                performance.name,
                performance.performancePlace.region.name,
                startEndDateResult?.startDate,
                startEndDateResult?.endDate
            )
        }

    }
}- 위 코드는 먼저 performance 리스트를 조회(첫번째 쿼리)한 후, 이를 id를 key, performance 엔티티를 Value로 설정한 Map으로 변환합니다.
- 이때 LinkedHashMap을 사용해 DB에서 이미 정렬된 결과를 유지해 추가적인 정렬이 필요없도록 합니다.
-
- 두 번째 쿼리도 id를 key, dto 객체를 value로 설정한 map을 생성합니다
- 그리고 두 map을 병합하여 해당 메서드의 최종 결과값인 PerformanceSummarySearchResult를 만듭니다.
- 위 코드 처럼 Map을 사용하면 O(N)으로 처리가 가능합니다.
- 이제 이 코드를 사용해서 배포환경에서 하기 전에, 실제로 빨라졌는지 확인하기 위해 로컬에서 성능 테스트를 해보도록 하겠습니다.
성능 테스트
- 먼저 로컬 컴퓨터의 성능과 테스트 데이터의 갯수는 다음과 같습니다.
12 논리 코어, 16GB 메모리
Performance 100120개
PerformanceDateTimes 301080개(Performance당 3개)
PerformancePlace 100개
Region 34개
테스트 시나리오는 다음과 같습니다.
- 10분동안 10명의 사용자가 1~10페이지까지 반복하며 조회
import http from 'k6/http';
import { sleep, check, group } from 'k6';
import { URL } from 'https://jslib.k6.io/url/1.0.0/index.js';
import { Trend } from 'k6/metrics';

export const options = {
    vus: 10,
    duration: "10m"
};

const pageDurations = {};
for (let i = 1; i <= 10; i++) {
    pageDurations[`page_${i}_duration`] = new Trend(`page_${i}_duration`);
}

export default function () {
    const baseUrl = 'http://localhost:8080/api/performances';
    let cursor = null;

    for (let page = 1; page <= 10; page++) {
        group(`Page ${page}`, function () {
            let url = new URL(baseUrl);

            if (cursor) {
                url.searchParams.append('cursor', cursor);
            }

            const res = http.get(url.toString());

            pageDurations[`page_${page}_duration`].add(res.timings.duration);

            check(res, {
                'status is 200': (r) => r.status === 200
            });

            if (res.status !== 200) {
                return;
            }
            const body = JSON.parse(res.body);
            cursor = body.cursor;
        });

        sleep(1);
    }
}
- 결과는 다음과 같습니다.
checks.........................: 100.00% 588 out of 588
http_req_failed................: 0.00% 0 out of 588
http_reqs......................: 588 0.933324/s
iteration_duration.............: avg=1m46s min=1m37s med=1m44s max=2m0s p(90)=2m0s p(95)=2m0s page_1_duration................: avg=10746.132313 min=8634.6932 med=11024.81795 max=12567.6161 p(90)=12280.62562 p(95)=12281.1019
page_10_duration...............: avg=9020.222608 min=6149.41 med=9073.95445 max=12680.2308 p(90)=9780.12223 p(95)=10123.065595
page_2_duration................: avg=10072.486313 min=6571.5855 med=10131.805 max=11970.2882 p(90)=11913.17346 p(95)=11939.131765
page_3_duration................: avg=9671.482362 min=6430.7444 med=9946.0489 max=11518.5006 p(90)=10638.56177 p(95)=10714.525395
page_4_duration................: avg=9722.537405 min=6380.331 med=9514.90905 max=12410.5782 p(90)=12379.5608 p(95)=12395.668025
page_5_duration................: avg=9659.557945 min=6723.4605 med=9791.44755 max=11440.0069 p(90)=11383.45661 p(95)=11421.089305
page_6_duration................: avg=9294.768578 min=7442.2658 med=9337.41215 max=11111.0523 p(90)=10434.56965 p(95)=10460.555065
page_7_duration................: avg=9257.418388 min=6674.565 med=9238.90805 max=11492.471 p(90)=11397.83355 p(95)=11461.91253
page_8_duration................: avg=9152.234917 min=6258.2182 med=9287.9181 max=10565.4895 p(90)=10055.31368 p(95)=10125.222115
page_9_duration................: avg=9311.415317 min=6492.7051 med=9431.0211 max=13055.4708 p(90)=12684.69708 p(95)=12942.98768
- 각 페이지당 평균적으로 10초의 조회시간이 걸렸으며, 백분위 95%의 사용자가 12초 안에 답변을 받음을 알 수 있습니다.
- 개선된 쿼리 테스트
- 테스트 조건은 동일합니다.
checks.........................: 100.00% 6000 out of 6000
http_req_failed................: 0.00% 0 out of 6000
http_reqs......................: 6000 9.869459/s
page_1_duration................: avg=17.380758 min=7.9309 med=10.6079 max=402.3716 p(90)=12.9373 p(95)=13.905
page_10_duration...............: avg=11.227898 min=8.0075 med=10.9666 max=17.1482 p(90)=12.9504 p(95)=14.3512
page_2_duration................: avg=12.165052 min=8.699 med=11.16505 max=53.9917 p(90)=13.3816 p(95)=15.7468
page_3_duration................: avg=11.57653 min=7.6035 med=11.1706 max=19.7809 p(90)=13.53253 p(95)=14.6724
page_4_duration................: avg=11.894249 min=8.011 med=11.52725 max=20.001 p(90)=14.30612 p(95)=16.863385
page_5_duration................: avg=11.08878 min=7.9513 med=10.8438 max=17.3473 p(90)=12.791 p(95)=13.566505
page_6_duration................: avg=11.518163 min=8.5884 med=11.0645 max=25.8538 p(90)=13.3144 p(95)=14.8053
page_7_duration................: avg=12.016215 min=8.7637 med=11.2217 max=45.4625 p(90)=13.71794 p(95)=15.5838
page_8_duration................: avg=11.510757 min=6.9655 med=11.13165 max=21.766 p(90)=12.9902 p(95)=16.36166
page_9_duration................: avg=11.689833 min=8.0945 med=11.0177 max=22.0022 p(90)=14.3027 p(95)=16.136915 vus............................: 10 min=10 max=10 vus_max........................: 10 min=10 max=10
- 각 페이지당 평균적으로 11ms 정도 소요됨을 알 수 있고, 95%의 사용자가 16ms안에 응답을 받을 수 있었습니다.(약 99.9%의 개선)
반정규화 하기
- 이미 충분히 개선된거 같긴 하지만, 조금 더 개선할 여지가 남아있습니다. 바로 반정규화를 사용해 regionName을 performance에 저장하면 JOIN 없이 첫번째 쿼리를 호출 할 수 있습니다.
ALTER TABLE performances
ADD COLUMN place_name VARCHAR(255),
ADD COLUMN region_name VARCHAR(255);

UPDATE performances p
JOIN performance_places pp ON p.place_id = pp.id
JOIN regions r ON pp.region_id = r.id
SET p.place_name = pp.name,
    p.region_name = r.name;
select p.id, p.uid, p.image, p.name as 'title' , p.region_name as 'regionName'
from performances p
order by p.id
desc limit 10;
select p.id, p.uid, p.image, p.name as 'title' , p.region_name as 'regionName'
from performances p
where id > (select id from performances p1 where p1.uid = 'xx-eZeD7Kp')
order by p.id
desc limit 10; - 첫번째 쿼리가 위와 같이 JOIN없이 클린하게 작성될 수 있습니다.
| select_type | table | type | possible_keys | key | ref | filtered | Extra |
| PRIMARY | p | range | PRIMARY | PRIMARY | 100.00 | Using where; Backward index scan | |
| SUBQUERY | p1 | const | uk_performances_uid,UKt0sabc8cnk5otxowyqwsrlwhy | uk_performances_uid | const | 100.00 | Using index |
- 정상적으로 index sort도 적용됨을 확인할 수 있습니다.
- 그럼 반정규화를 적용한 채로 다시 동일한 테스트를 해보도록 하겠습니다.
checks.........................: 100.00% 6000 out of 6000 http_req_failed................: 0.00% 0 out of 6000 http_reqs......................: 6000 9.876259/s
page_1_duration................: avg=16.474105 min=6.8876 med=10.078 max=437.9993 p(90)=11.5671 p(95)=13.66465
page_10_duration...............: avg=10.948924 min=7.5174 med=10.5628 max=20.9899 p(90)=13.513 p(95)=14.151565
page_2_duration................: avg=11.322002 min=7.8967 med=10.421 max=50.2296 p(90)=12.6877 p(95)=14.3196
page_3_duration................: avg=10.891064 min=8.0072 med=10.37805 max=22.0607 p(90)=12.50935 p(95)=14.4519
page_4_duration................: avg=10.87548 min=7.9638 med=10.3528 max=18.659 p(90)=13.68954 p(95)=14.963265
page_5_duration................: avg=10.77193 min=8.0425 med=10.357 max=19.5613 p(90)=12.17873 p(95)=14.2962
page_6_duration................: avg=10.888312 min=7.567 med=10.3686 max=29.0662 p(90)=12.80885 p(95)=13.9582
page_7_duration................: avg=10.979036 min=7.4739 med=10.5193 max=20.5428 p(90)=12.9696 p(95)=14.90885
page_8_duration................: avg=10.83324 min=6.8544 med=10.4508 max=16.5683 p(90)=13.0025 p(95)=13.8474
page_9_duration................: avg=10.922153 min=8.3057 med=10.5629 max=19.6698 p(90)=12.8252 p(95)=13.99075 vus............................: 10 min=10 max=10 vus_max........................: 10 min=10 max=10
- 이미 개선한 코드에 반정규화까지 하니, 95 percentile 기준으로 6.4%가 평균적으로 개선되었습니다.
결론
- 기존의 10초 이상 걸리는 코드를 10ms 내외로 개선하였습니다.
- 다음에는 실제 배포를 해서 배포 환경에서 서버의 한계치를 측정해보고 병목지점이 어디인지 파악한 후 개선해보고자 합니다.
- 만약 추가적인 개선이 필요하다면 StartDate와 EndDate도 반정규화를 하면 쿼리를 한번으로 줄일 수 있습니다.
- 마지막으로, 혹시나 Region이나 PerformancePlace의 이름을 바꿀일이 있다면, 수정이상을 방지하기 위해 JOIN으로 Performance의 값까지 한꺼번에 바꾸어 줘야 합니다.
반응형